

DynamiScan: Direct Mail Analytics That Turns Responses Into Marketing Intelligence
Know who responded, what they responded to, where they came from, and what your next direct mail campaign should do differently.
DynamiCard developed DynamiScan to give businesses something traditional direct mail often lacks: actionable customer intelligence after the mailpiece reaches the market.
DynamiScan is a direct mail analytics platform designed to help businesses capture campaign response, identify responding customers, analyze demographic patterns, compare offers, visualize geographic activity, and use real campaign data to improve future mailings.
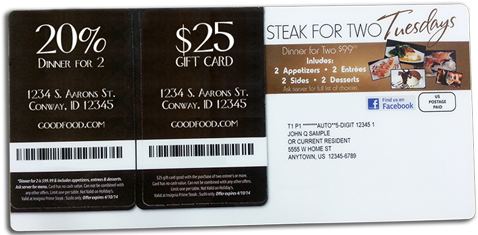
Instead of looking at a direct mail campaign as a one-time print-and-mail project, DynamiScan helps turn each response into information your business can learn from.
- Which audiences are responding?
- Which offers produce the strongest results?
- Where are new customers coming from?
- How are different locations performing?
- Which customers have already responded?
- What should you change before the next mailing?
DynamiScan gives DynamiCard clients a more structured way to answer those questions.
What Is DynamiScan?
DynamiScan is DynamiCard’s proprietary direct mail response tracking and campaign analytics technology. The platform is designed to connect customer redemption activity with data about the audience, offer, location, and campaign.
When a trackable DynamiCard mailpiece is redeemed, DynamiScan can capture the response and use that activity to help businesses understand who engaged with the campaign. DynamiCard’s current system supports analysis of factors such as:
- Customer demographics
- Offer response
- Geographic response patterns
- Customer identification
- Multi-location performance
- Repeat customer behavior
- Campaign response rate
- Respondent information
- Offer and revenue comparisons
The existing platform also includes real-time dashboard functionality, geomapping, multiple-offer testing, and respondent-list downloads. That creates a fundamentally different direct mail conversation. Instead of asking only:
“How many postcards did we send?”
“Who responded, what did they respond to, and what can that teach us?”
Direct Mail Analytics Built Around Real Customer Response
Marketing analytics are most valuable when they help a business make a decision. Collecting data for the sake of having more reports does not improve a campaign.
DynamiScan is designed around the actions that occur after direct mail reaches the customer. A campaign might begin with thousands of mailpieces. But the real intelligence comes from understanding the people who respond. DynamiScan can help marketers evaluate:
- Who responded?
- Which offer generated the response?
- Which demographic characteristics appear among responders?
- Where do responding customers live?
- Which locations are producing results?
- Which customer segments may deserve more — or less — future marketing attention?
This makes campaign analytics part of direct mail strategy rather than something added after the mailing is complete.
Direct Mail Response Tracking
The first step in better analytics is knowing that a response occurred. DynamiScan provides direct mail response tracking by connecting campaign redemptions with the mailpieces and offers that generated them.
- A customer receives the campaign.
- They respond to the offer.
- The redemption is captured.
DynamiScan turns that interaction into measurable campaign information. That allows marketers to evaluate more than overall sales activity happening during the campaign period. They gain another way to connect customer behavior with the physical marketing that helped create it.
Identify the Customers Responding to Your Mail
A response number tells you how many people acted. Customer identification can help reveal who those people are.
DynamiCard’s existing DynamiScan functionality is designed to capture respondent names and addresses when customers redeem through the system. That creates opportunities to better understand:
- New customer activity
- Returning customer behavior
- Respondent geography
- Offer preferences
- Future audience strategy
Instead of treating the responding customer as an anonymous number on a report, businesses can use campaign response to build a more useful picture of their audience.
Understand Which Demographics Are Responding
DynamiScan’s current reporting framework includes multiple demographic categories associated with responding customers. These include:
- Age
- Income
- Gender
- Marital status
- Length of residence
- Year home built
- Households with or without children
- Households with or without seniors
- Owner versus renter
- Home value
- Home type
These reporting categories are currently presented as standard DynamiScan reports on DynamiCard’s Tracking & Analytics page. That information can help businesses identify patterns within campaign response. For example:
- Are certain demographic groups responding more often?
- Are other segments consistently producing weak activity?
- Does one offer appeal to one audience while another works better with a different group?
Those findings can inform future direct mail decisions.
Turn Direct Mail Attribution Into Better Decisions
Direct mail attribution means creating a connection between customer activity and the campaign that influenced it. That can be difficult with traditional direct mail.
- A customer receives a postcard. Days later, they visit the business.
- Another calls.
- Another redeems a physical offer.
- Another responds to a different promotion.
Without tracking, those activities can blend into normal business traffic. DynamiScan creates another attribution mechanism by connecting trackable campaign response with the customer and offer. That helps businesses move away from assumptions and toward documented campaign behavior.
Know Which Offers Drive Response
A strong audience with a weak offer can still produce disappointing results. That makes offer testing an important part of direct mail optimization.
DynamiScan is designed to let businesses evaluate multiple offers and compare how customers respond to each one. DynamiCard’s existing feature set specifically supports testing multiple offers at the same time and evaluating which generate visits and revenue. That creates opportunities to compare:
- Response volume
- Customer type
- Average transaction behavior
- Location performance
- Revenue contribution
- Audience preference
The objective is not simply to determine which coupon was redeemed most. A better analysis asks:
Which offer produced the type of customer and business outcome we actually want?
Test Multiple Offers Within One Mailing
Traditional testing often requires separate campaign cycles.
- Mail one offer.
- Wait.
- Evaluate.
- Change the campaign.
- Mail again.
DynamiScan provides another approach by supporting multiple offers within a campaign and allowing marketers to compare results as customers respond. This can help businesses learn more efficiently about:
- Offer preference
- Customer segments
- Revenue patterns
- Geographic differences
- Store or location performance
Testing becomes part of the campaign architecture rather than a separate project.
Real-Time Campaign Analytics Dashboard
Campaign data becomes more useful when marketers can actually see and interpret it. DynamiScan includes a real-time dashboard designed to organize response information into a more usable reporting environment.
Instead of manually building spreadsheets after every campaign, businesses can use the platform to follow measurable response as it develops. This can be particularly helpful for:
- Ongoing direct mail programs
- Multi-location businesses
- Large mailing campaigns
- Campaigns testing multiple offers
- Organizations managing several markets
The purpose of the dashboard is not simply visualization. It is faster access to information that can influence business decisions.
See Customer Response on a Map
Knowing that customers responded is useful. Knowing where those customers came from can reveal another layer of campaign intelligence.
DynamiScan includes real-time geomapping capabilities that visualize the geographic locations associated with customer response. That can help marketers identify:
- Strong-performing geographic areas
- Weak-response areas
- Customer clusters
- Differences between neighborhoods
- Potential future mailing opportunities
- Areas where continued investment may deserve reconsideration
For businesses driven by geography, this can be particularly valuable. A restaurant may discover that customers consistently travel from a particular community. A retailer may see stronger customer acquisition around certain locations. A service business may identify areas producing meaningful response.
Geography stops being just where the mail was sent. It becomes part of the performance analysis.
Direct Mail Analytics for Multiple Locations
Multi-location organizations face a measurement challenge that single-location businesses do not: which location actually generated the result?
DynamiScan is currently designed to support multiple locations within its tracking environment. That can help businesses evaluate:
- Location-by-location response
- Market differences
- Offer performance
- Customer activity
- Geographic trends
- Comparative campaign performance
Instead of one blended response number for the entire organization, marketers can begin understanding how different locations perform. This can be especially useful for:
- Restaurant groups
- Retail chains
- Franchise systems
- Automotive businesses
- Healthcare organizations
- Fitness businesses
- Other multi-location companies
Understand New Customer Behavior
Customer acquisition is often one of the central objectives of direct mail. But acquiring a customer is only the beginning of the measurement story.
DynamiScan is designed to help businesses identify new customers generated through direct mail and better understand their subsequent behavior. That can help marketers begin evaluating:
- Which campaign brought the customer in
- Which offer they responded to
- Which customer characteristics appear most frequently
- Whether the customer returns
- Which offers the customer prefers
This provides a more useful customer view than simply recording one initial redemption.
Measure Repeat Customer Activity
A customer generated through direct mail can continue producing value after the original campaign ends. DynamiScan’s current platform is designed to help businesses understand repeat customer activity and identify which offers those customers respond to. That can help answer questions such as:
- Did customers acquired through Campaign A return?
- Did Campaign B attract more repeat business?
- Are certain offers associated with stronger customer retention?
- Are particular audience segments more valuable over time?
Those are more strategic questions than simple response counting.
Stop Sending the Same Acquisition Offer to Existing Responders
Once someone responds to an acquisition campaign, continuing to send the same promotion may not be the most efficient use of marketing resources.
DynamiScan’s existing functionality is designed to identify responding customers and can help businesses manage whether those responders continue receiving the same offer until the company chooses to re-engage them. This creates an opportunity to move from static mailing lists toward more responsive audience management.
A customer who has already converted may need a different message. A non-responder may require another strategy. Tracking can help inform that distinction.
Use Customer Identification to Refine Future Mailing Lists
Analytics become more valuable when they influence what happens next. A business may discover that a large portion of its strongest responders share certain characteristics. Another group may repeatedly produce little activity. Those findings can help shape future mailing decisions.
DynamiScan can support a feedback loop:
- Track response
- Identify customer patterns
- Refine targeting
- Launch the next campaign
- Measure again
That is how direct mail becomes increasingly data informed over time.
Download Respondent Data for Your Own Analysis
Some businesses want the ability to work with campaign data beyond the reporting dashboard. DynamiScan currently includes respondent-list download functionality that can provide customer and response information for additional analysis. Depending on the organization, exported response information may support:
- Internal analysis
- Customer database management
- Future campaign planning
- Reporting
- Audience refinement
- Business intelligence workflows
Businesses should always handle customer information according to applicable privacy requirements and their own data policies.
DynamiScan and Direct Mail ROI
Response data becomes especially valuable when it can be connected with campaign economics. DynamiScan’s existing positioning includes reporting around campaign performance, profitability, customer response, and new customer behavior. DynamiCard also highlights DynamiScan as part of its response-tracking dashboard and profitability analysis capabilities elsewhere on the site.
The objective is to help businesses move from:
- Mail volume
- Response
- Customer
- Revenue
- Return
That creates a more complete view of campaign performance.
DynamiScan vs. Basic Coupon Tracking
A simple coupon tells you that someone redeemed an offer. DynamiScan is designed to answer more questions around that redemption. Basic tracking might tell you:
25 people used Offer A.
A deeper analytics approach can explore:
- Who were those customers?
- Where did they live?
- What demographic patterns appeared?
- Which location generated the response?
- How did Offer A compare with Offer B?
- Did those customers return?
- Should similar customers receive another campaign?
That additional context is what turns redemption tracking into campaign analytics.
DynamiScan and QR Code Tracking
DynamiScan does not need to be the only measurable response mechanism within a campaign. DynamiCard’s broader technology ecosystem includes Dynamic QR Code Tracking.
QR technology creates another type of response. The mailpiece arrives. The recipient scans. The physical interaction becomes digital.
DynamiScan and QR tracking can serve different parts of the measurement strategy depending on how the campaign is structured.
DynamiScan and Phone Tracking
Some customers respond by walking into a location and redeeming an offer. Others pick up the phone.
DynamiCard also provides dedicated Phone Tracking as part of its current technology offering. The service is linked directly from the site’s primary navigation alongside Tracking & Analytics, Delivery Tracking, and Dynamic QR Code Tracking.
Combining relevant response technologies gives businesses more opportunities to understand how customers engage with direct mail.
DynamiScan and Mail Delivery Tracking
DynamiScan focuses primarily on what customers do when responding. Delivery Tracking provides another part of the campaign story: when did the physical mail reach the market?
DynamiCard’s delivery technology can provide timing context around the campaign, while DynamiScan can help analyze customer response afterward. Together, the sequence becomes more visible:
- Mail enters delivery
- Campaign reaches customers
- Customers respond
- DynamiScan captures measurable redemption activity
- Marketers analyze the results
DynamiScan and Addressable Geofencing
Direct mail campaigns can also extend beyond the physical postcard. DynamiCard’s broader technology strategy includes Addressable Geofencing, which supports the connection between physical direct mail and digital advertising. This creates another opportunity for cross-channel measurement.
The mailpiece creates physical awareness. Digital advertising reinforces the campaign. DynamiScan provides insight into measurable direct-response activity. Other tracking technologies provide additional customer signals. Together, those components support a more connected marketing ecosystem.
DynamiScan for Plastic Postcard Campaigns
DynamiScan has a particularly close relationship with DynamiCard’s Plastic Postcard Mailers. The existing platform is specifically positioned around scanning and measuring offers redeemed from DynamiCard plastic and Eco postcard campaigns. The combination creates two different advantages:
- The postcard helps create the physical customer interaction.
- DynamiScan helps measure what that interaction produces.
This makes the analytics platform a natural extension of DynamiCard’s core direct mail product strategy.
DynamiScan for Restaurants
Restaurant campaigns can generate valuable point-of-sale response data. A restaurant might use DynamiScan to better understand:
- Which offers are redeemed
- Who responds
- Which neighborhoods produce customers
- Whether customers return
- Which promotions drive stronger transactions
- Differences between locations
DynamiCard’s site also currently features customer feedback specifically describing DynamiScan’s usefulness for restaurant managers and demographic reporting.
DynamiScan for Retail
Retail direct mail campaigns can benefit from understanding more than coupon redemption totals. DynamiScan can help retailers examine:
- Customer demographics
- Offer response
- Geographic activity
- New customer capture
- Repeat behavior
- Multi-location differences
For retailers with several stores, location-level reporting can become particularly valuable.
DynamiScan for Automotive Businesses
Automotive businesses can use direct mail across customer acquisition, service promotions, maintenance campaigns, and reactivation initiatives. DynamiScan can support analysis around:
- Offer redemptions
- Customer profiles
- Repeat visits
- Market performance
- Location differences
- Future targeting
The objective is to determine which campaigns are producing customers worth reaching again.
DynamiScan for Multi-Location Brands and Franchises
As campaign scale increases, reporting complexity increases with it. A franchise or multi-location brand may need to understand:
- Which stores are responding best?
- Which markets perform differently?
- Are the same offers working everywhere?
- Do customer demographics change by location?
- Where should the next campaign budget go?
DynamiScan’s multi-location capabilities are designed to give these organizations greater visibility into campaign performance across locations.
How DynamiScan Works
- Build the Direct Mail CampaignDynamiCard works with the business to create the direct mail strategy, audience, physical mailpiece, and offer structure.
- Make the Campaign TrackableThe campaign is configured around measurable redemption or response mechanisms.
- Mail the CampaignThe physical mailpiece reaches the intended market.
- Capture ResponseWhen customers respond through the DynamiScan workflow, their campaign activity can be recorded.
- Connect Response with Customer InformationDynamiScan uses campaign and respondent information to help identify patterns.
- Analyze Offers and AudiencesMarketers can compare customer segments, promotions, markets, and locations.
- Review Campaign AnalyticsDashboards, geomapping, response information, and other analytics help make the results easier to evaluate.
- Improve the Next MailingUse actual response information to refine audience selection, offers, geographic focus, and campaign strategy.
Why DynamiScan Is Different
Most direct mail companies can print. Many can mail. DynamiScan gives DynamiCard a proprietary analytics layer around what happens after the mailpiece reaches the customer.
Direct Mail Response Tracking
Capture measurable campaign redemption activity.
Customer Identification
Connect responses with respondent information.
Demographic Analytics
Understand characteristics associated with responding customers.
Offer Intelligence
Compare multiple offers and customer behavior.
Real-Time Dashboard
Review campaign activity through an accessible reporting environment.
Geomapping
See geographic patterns in customer response.
Multi-Location Analytics
Compare campaign activity across multiple business locations.
Respondent Data
Download campaign response information for additional analysis.
Repeat Customer Insights
Understand more about what customers do after their initial response.
DynamiScan helps turn direct mail from:
“Send and hope.”
“Send, measure, learn, and improve.”
Frequently Asked Questions About DynamiScan
What is DynamiScan?
DynamiScan is DynamiCard’s direct mail analytics and response-tracking platform. It is designed to capture campaign redemption activity and help businesses analyze customers, demographics, offers, locations, and response patterns.
Is DynamiScan a direct mail analytics platform?
Yes. DynamiScan provides campaign analytics capabilities including response tracking, demographic reporting, dashboards, geomapping, offer testing, multi-location reporting, and respondent data.
Can DynamiScan identify customers who respond?
DynamiCard’s current Tracking & Analytics page states that DynamiScan collects respondent names and addresses through its redemption workflow.
What demographic information can DynamiScan analyze?
DynamiCard currently lists reporting fields including age, income, gender, marital status, home characteristics, household composition, owner/renter status, home value, and related demographic categories.
Can DynamiScan compare multiple offers?
Yes. The existing platform supports testing multiple offers simultaneously and comparing which generate visits and revenue.
Does DynamiScan support multiple locations?
DynamiCard lists DynamiScan as multi-location enabled.
Does DynamiScan include geomapping?
Yes. Real-time geomapping is currently listed among DynamiScan’s features.
Can respondent data be downloaded?
DynamiCard’s current feature set includes respondent-list download functionality.
Does DynamiScan track QR codes and phone calls?
DynamiCard offers QR Code Tracking and Phone Tracking as separate technologies within its larger direct mail tracking ecosystem. DynamiScan should be positioned as the proprietary response analytics product while those services remain supporting tracking channels.